We Are All Factor Investors

Smart beta, indexing, Fama/French, margin of safety, Graham (deep) value, growth, momentum, GARP. Each of these terms represent very different styles of investing, but they all have one thing in common: they are all predicated on the fact that certain factors have, and will continue to, drive stock returns.

·         Smart Beta: fundamental-weighting, low volatility

·         Indexing: market cap (larger better), costs (lower better)

·         Fama/French: book/price (higher better), market cap (smaller better)

·         Margin of safety: business moats, cheap valuations

·         Graham Value: very cheap valuations

·         Growth: earnings growth

·         Momentum: strong price trends

·         GARP: strong earnings growth and reasonable valuations

If you think about the stock selection process, you’ll see that everyone makes decisions based on some factor(s).

How we make investing decisions

If you are an “active” manager, trying to select stocks that will outperform the market, the process is always the same, and it looks like this:

Both traditional and quantitative managers follow this same process: they collect data they believe to be relevant, process/evaluate that data, and reach conclusions. They buy certain stocks based on certain factor inputs.

Each approach has one major weakness (and many other small ones).

Quantitative Weakness: The quantitative approach is reliant on data that tends to be fairly raw. This means that its weakness lies in its lack of nuance. Raw reported data will sometimes be wrong or hide important realities (think off balance sheet items on bank balance sheets in 2008).  I don’t mean to plant the axiom that traditional managers all do pick up on these inaccuracies/nuances, but some do and have been successful as a result.

Traditional Weakness: Any good strategy only works if it is consistently applied over long periods in the market, but human beings are extremely inconsistent thinkers. This means that relative to quantitative managers, it is very hard for traditional managers to measure and apply their preferred factors across a large universe of stocks, and to do so consistently through time.

One of the reasons that indexing works is that it is so consistent. Its strategy (buy big stocks, the bigger the better) is mediocre, but it never veers off course. Most humans are extremely inconsistent in their decision making and processing of information. Losing $100, for example, has twice the emotional impact on the average human than does gaining the same $100 dollars: we are wired to be especially sensitive to losses.

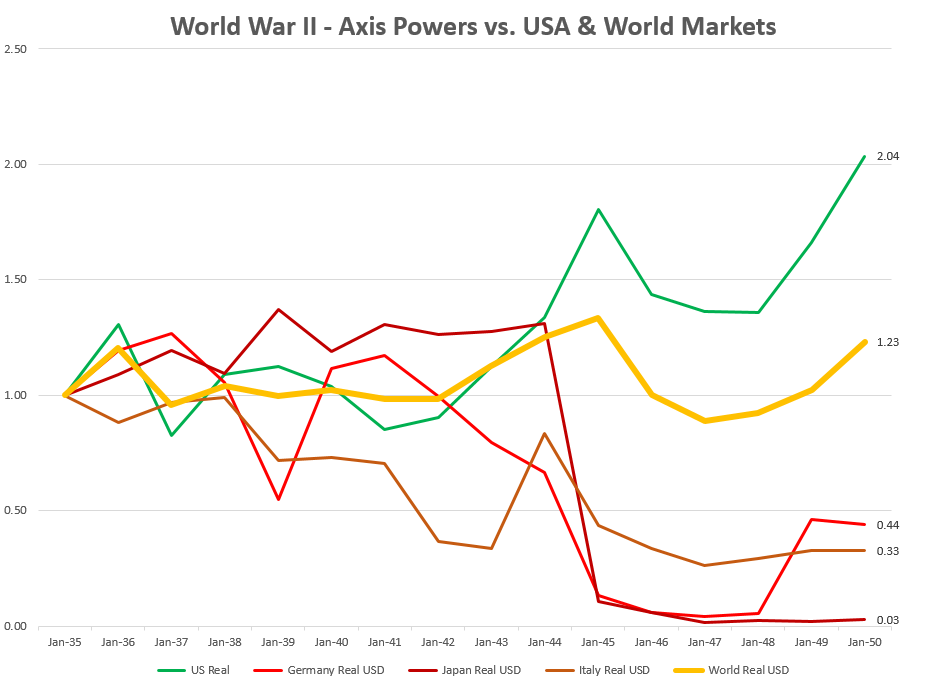
You can see this tendency in the following chart of all U.S. stock market bull/bear markets. The bulls tend to be slow & plodding, often lasting many years. The bears, by contrast, tend to be sharp, quick and painful.  They are fueled by panic: our oversensitivity to losses.

Humans are a lollapalooza of behavioral biases, and these biases precipitate bad decisions.  Because we aren’t well wired to make smart and consistent investing decisions, I believe that the quantitative approach is superior despite its weaknesses; it removes emotional influences from the investing process. If you believe in factor investing over index investing, then the quantitative approach is more reliable.

Factor Investing in the Future

The funny thing about factors is that just like individual stocks themselves, a factor’s short term success will likely be inversely related to its popularity among investors (which will, of course, wax and wane). Measuring a stocks popularity is pretty easy: lofty valuations, large returns over the past few years, and very high share turnover can all help you identify the most popular stocks (and as I’ve written here and here, they tend to perform terribly). But identifying popular factors is more difficult.  We can look at factor spreads (e.g. how much cheaper are the cheapest stocks than the most expensive stocks) and conclude that the narrower the spread—and therefore the more similar stocks look—the more popular the factor. We can also look, more subjectively, at how often certain factors are mentioned and what sort of fund flows they are garnering (think of the large inflows into dividend yield in 2012, which went on to underperform in 2013). These are imperfect, though, so timing factors will be difficult.

Investing is an incredibly complex endeavor, so it is impossible to sum it up…but J.M. Keynes came close when he said, "It is largely the fluctuations which throw up the bargains and the uncertainty due to fluctuations which prevents other people from taking advantage of them." So long as people (compelled by human nature) are responsible for pricing stocks, one edge will likely persist: that which is out of favor—be it a stock, industry, country, or a factor—will likely outperform.  It is psychologically difficult to do, but if you want to beat the global market index funds, you’ll have to position yourself in parts of the market that others disdain. Picking factors in the short term will be as difficult as picking stocks in the short term. I think the key is to instead focus on the longer term: do your own investigating, find what factors make sense to you, and stick with them through thick and thin. 

Portfolio Patriotism, and Why You Should Avoid It

The U.S. equity market is expensive.  The median stock is about as pricey as it’s been in 50 years, and valuations are all clustered: there are far fewer bargains than in years past. I am not an index investor, so I generally pay less attention to market-level valuation measures like the Shiller P/E or Tobin’s Q—but both show the U.S. market as expensive. These valuation tools are more strategic than timing tools, but both signals advise caution.

What’s strange, then, is how little attention global equities get.  The debate is all about the U.S. market, which represents less than half of the global stock market.  But today, non-U.S. equities are cheaper than U.S. equities, with more bargains to be had. One simple example: among companies with a market cap greater than $200MM, there are about 100 companies in the U.S. that still have a price-to-earnings multiple below 10; there are more than 550 Non-U.S. stocks with a P/E below 10.

American investors need to diversify globally, because having all one’s risk tied up in one market doesn’t make sense—especially when that market is the most expensive developed market in the world.  It’s not just because valuations are better abroad, but because history teaches us again and again that individual country markets can have long, tumultuous periods of negative returns. Luckily, the global market portfolio usually holds up well.

Portfolio Patriotism

The preference to own companies in one’s home country is one of the most pervasive and persistent biases in investing.  We prefer familiar companies that offer products or services that we use and know. Lots of U.S. investors own Coke, but very few own Suntory (a Japanese drinks company).  The overweight to home countries is often extreme. In 2010, the U.S. market was roughly 43% of the global stock market, but U.S. investors had 72% of their portfolios allocated to U.S. stocks. It’s much worse in smaller countries like Canada and the U.K. In 2010, Canadian stocks were roughly 5% of the global market, but Canadian investors had a 65% allocation to their domestic market (the U.K. was very similar: 8% of the global market, but U.K. investors had a 50% allocation)[i].

If you believe in index investing, then a “neutral” or “passive” portfolio would be the MSCI All-Country World Index or some similar benchmark, but few portfolios look like the ACWI. Even though the U.S. has been the dominant stock market for more than 100 years, there are compelling reasons to own a more global portfolio.

Using the incredible long-term global equity market data built by Dimson, Marsh, and Staunton, we can review the history of individual country equity markets to make the case that you should not bundle all your risk into one country.  There have been many examples of disaster within one market, so to think that similar disasters won’t happen in the future is naïve.  Throughout it all, the global equity portfolio has held up remarkably well. 

Triumph of the Optimists                     

based on annual data from Dimson, Marsh & Staunton

based on annual data from Dimson, Marsh & Staunton

Dimson, Marsh and Staunton’s book Triumph of the Optimists is a must-read for many reasons, but the core message (hinted at in the title) is that equity markets across the 20 major countries that the authors studied have performed well since 1900 —19 have delivered positive returns after inflation. At the right is a table of the annualized returns for these 20 countries between 1900 and 2012 (note: 2013 data not yet available, so these numbers would all get better, sometimes much better). The U.S. market has been one of the top performing markets over the past 113 years.  It lagged Australia and South Africa, but because it was many times the size of those smaller markets, its performance has been amazing. It is interesting to note that the top markets are very rich in natural resources.

Worst Case Scenarios

While the long term record has been strong for equities, nobody has a 113 year time horizon (well, unless you are Ray Kurzweil). Investors are still jittery today and worried about the risk in stocks, so I ran the worst-case scenarios for all 20 equity markets over a variety of different holding periods, which are listed in the table below (these returns are in US dollars, so they represent the returns that a U.S. investor would earn rather than a local investor in each respective market—the local returns are quite similar).

based on annual data from Dimson, Marsh & Staunton

based on annual data from Dimson, Marsh & Staunton

While the U.S. has never had a negative 20-year period of returns, most markets have. Other than the U.S., only the Canadian and Australian markets have provided positive returns in all 20-year periods. Because the U.S. has such a dominant weight in the World portfolio, I’ve also included an equal weight portfolio here, which does very well (equal weight to each of the 20 countries, rebalanced annually).

Here is the cumulative growth of the three best markets alongside the three worst and the world portfolio since 1900.  

based on annual data from Dimson, Marsh & Staunton

based on annual data from Dimson, Marsh & Staunton

World War II

You’ll notice in the table above that many of the countries that have had very bad 40+ year worst-case scenarios were in the thick of things during World War II. Along with the Great Depression, World War II was the most disruptive influence on stock market returns. Below are the results for the U.S. and Axis powers in and around the war.  As always, to the victor go the spoils. Germany’s stock market was essentially “reset” after the wind down of its three major banks (that had sympathized with the Nazis) in 1948, so German investors were wiped out.

based on annual data from Dimson, Marsh & Staunton

based on annual data from Dimson, Marsh & Staunton

The worst case scenario for us in the future would be some similar dislocation that crushed the U.S. equity market. It is interesting to note how the world portfolio performed (because it included both the winners and the losers--again this is in US Dollars but local version is similar).  Of course, it would have been very hard (or impossible) to own a global portfolio in the 1940’s, but today it’s easy.

Go Global

Overcoming portfolio patriotism is important if you want to reduce long-term risk in your portfolio.  The U.S. market has indeed had a remarkable multi-century run, and some of that success may be because America is “exceptional” in some key ways (then again, the insane American demographic explosion didn’t hurt, but that effect has stabilized—with a fertility rate of 1.9 we aren’t quite replacing our population). Still, other great countries have faltered in the past.

It just so happens that today, international country stock markets offer many of the best opportunities. As has been exhaustively demonstrated by many valuation experts (Grantham, Shiller, Meb Faber, and so on), the U.S. market is more expensive on an absolute and relative basis that most other major countries throughout the world. This isn’t a death sentence for the U.S. market, as there have been many examples where the market did quite well even from an expensive starting point. But it would be foolish, given how easy and cheap it is to buy global stocks, to keep your equity risk concentrated in your home country. This final chart is the Triumph of the Optimists writ large: it tracks the long term growth of $1 in the world equity portfolio (weighted by market cap) and an equal weighted version of the world portfolio. These returns include two World Wars, the Great Depression, countless recessions, crises, and market collapses. If you are an investor with a long time horizon, the global stock market should be the central part of your portfolio.

based on annual data from Dimson, Marsh & Staunton

based on annual data from Dimson, Marsh & Staunton


[i] https://advisors.vanguard.com/iwe/pdf/ICRRHB.pdf?cbdForceDomain=true

Forget Passive vs. Active--Here's How To Evaluate Any Investment Strategy

Burton Malkiel has a new piece up on Wealthfront’s website calling smart beta strategies into question. It’s a very interesting and hot debate at the moment, and Malkiel’s perspective is worth a read—many of his points are important to consider.    

The problem with this debate is that it is impossible to evaluate “smart beta” as an entire category relative to cap-weighted indexes, because smart beta strategies can be very different from one another. For example, a low volatility smart beta strategy will provide very different returns than a high momentum strategy. Any comparison between cap-weighted indexes and smart beta should be made on a strategy by strategy basis.

I think smart beta strategies should be assessed just like any strategy, and here I’ll lay out the criteria by which I think investment strategies should be evaluated. Hopefully you can use these criteria when making a decision between a smart beta strategy—or a traditional active strategy—and a traditional cap-weighted index.

Passive Investing—Misnamed, Misunderstood, and Flawed

First off, the debate between “passive” and “active” is misleading. As Cullen Roche recently pointed out in a post, everyone is active to some extent.  Every strategy is an active bet that certain stock selection and weighting criteria are better than others.

Cap-weighting is itself a strategy that says “buy big stocks, the bigger the better.”  Cap-weighted indexes are hard to beat because they are so cheap (and the fee differential between index funds and other strategies compounds over time) and the fact that rules-based cap-weighted indexes are inherently disciplined…they never deviate from their strategy.  The goal of Smart Beta indexes/ETFs is to use the same discipline, but build indexes with better rules. 

Malkiel’s best point is that costs (higher fees, taxes, and turnover) make some smart beta strategies inferior. But the piece, which denounces smart beta as a marketing tactic, is pretty light on empirical evidence. In a bit of cherry picking, Malkiel invokes the example of RAFI indexes taking on more risk in 2009 by overweighting bank stocks (which worked for RAFI), but leaves out the similar risky bets taken by cap-weighted indexes, like the massive weight to tech stocks in 2000 (which didn’t work for the S&P 500). Oh, and RAFI would have worked in the tech wreck, too, because fundamental indexes would have been very underweight the tech stocks that were producing very little sales/earnings/cash flows/dividends.

Evaluating Any Investment Strategy

Given that any investment strategy is active to some extent, I think there is a small list of important criteria when choosing where to put your money—whether it is indexing, smart beta/indexing, or traditional active. There are four main criteria worth considering.

#1 – Strategy consistency

Is the strategy rules based (and therefore consistent) or not? Consistency is very important for long-term success. Indexes—and Smart Beta—have this in their favor.  The S&P 500 “strategy” has never changed, so it has consistency baked in. Non-index managers are less consistent. According to this recent SPIVA report, over the past five years, just 46% of funds stayed consistent to their style. Switching strategies/styles at the right time is very hard to do. 

Bottom line: consistent approaches are better.

#2 – Selection Criteria

Rules-based is good, but the rules themselves are very important too. 

I spend a few chapters on this topic in my book, but the bottom line is that market cap is a convenient but sub-par weighting/selection criteria. Indexing is the right strategy for a lot of people and is a great basic way to own equities, but I also believe that the right kind of “smart” strategy will deliver superior results. Here’s one example why.

Imagine breaking up all of the investable stocks[i] in the U.S. market up into 10 equal groups (deciles) based on their market capitalizations. Decile 1 would have the 10% of companies with the biggest market caps, and decile 10 those with the smallest. Today, there are around 300 companies in each decile, and 3,000 investable stocks total. Then imagine doing the same thing every year back in time for the past 50 years.

The figure below illustrates how each size decile has performed relative to the equal weighted opportunity set. Not much information in the 8 smallest deciles, but the largest stocks have significantly lagged the equal-weighted market. In particular, the biggest group of stocks has lagged the equal weighted opportunity set by almost 2% per year. Here’s the problem: 78% of the weight of the S&P 500 is in this largest decile today.  The top 50 stocks by market cap have done even worse historically.

1963-2013

1963-2013

In contrast to market cap, there are a host of other rules that have worked for selecting stocks. A brief list includes: value, momentum, low volatility, quality (earnings quality, profitability), and small cap.  The effectiveness of these factors varies. Below is the value example I’ve used before: value is much more powerful than small cap.

Malkiel is right that these factors (on their own) can have long periods of underperformance: momentum did poorly in the 2000’s because of the ’09 momentum reversal. But typically, as the holding period lengthens, the “risk” of losing to the market fades. Here is the percentage of time that cheap large stocks (using earning/price) outperform all large stocks over the past 50 years. These factors (and any smart beta strategies using them) only work if you stick with them.

1963-2013

1963-2013

Smarter selection criteria have been proven to work over very long periods of time, arguably because these factors identify stocks that are systematically mispriced by the market; and the market is comprised of people who make systematic behavioral errors.  Value and Momentum are the two that work the best. We’ve known about each “anomaly” for a long, long time, and yet they’ve continued to deliver outsized returns.  

Bottom line: there are smarter ways than market cap to build a portfolio (before costs, we’ll get to those in a moment).

#3—Concentration

I loved Howard Mark’s latest shareholder letter, which is essentially an ode to “active share.” If your goal is to beat cap-weighted indexes, then your odds go up if you are very different from the index that you are trying to beat. There’s really no reason to be an “active” investor if you are just going to hug/slightly tilt an index.

Of course being different, or “daring to be great” as Mark’s calls it, brings the highest odds of ruin, too. There are smart ways to be different and dumb ways. The very long-term historical success of certain factors suggest that cheap stocks with good momentum is a smart way, and building a unique portfolio using value and momentum is the best way to “dare to be great.”

One of the main arguments against “active management” is that the average active manager loses to index funds—but this is like saying the Pope is Catholic or bears crap in the woods. Because of fees charged, active management is a negative sum game.  The entire group of investors will earn the market rate of return, and the average will be negatively offset by active management fees that are higher than index fund fees. As this paper on active share demonstrated, the group of funds with the most unique holdings (highest active share) has historically beat market-cap weighted indexes by 1.1% after costs/fees. It has paid to be different than the market.

Bottom line: if you don’t buy an index, you’ll want to focus on strategies that have unique holdings and high active share.

#4—Implementation Costs (Trading (Turnover), Taxes, and Fees)          

Turnover and taxes are hard to evaluate. Broadly speaking, the best strategies will have holding periods long enough that most gains are taxed as long-term capital gains. Trading/turnover get a bad rap, but turnover (and the taxes it brings) is really just the flexibility to move into more attractive opportunities. No turnover means you never adapt to changing market opportunities.  I think the best strategies balance trading costs and turnover with the need to buy newly attractive stocks (e.g. undervalued, good momentum) and sell stocks that look less attractive (e.g. overvalued, bad momentum).

Fees are most straightforward category. Lower is better, and here indexes have a massive advantage. But it will thin out in the years to come. Smart beta fees (and traditional active fees) will keep coming down. Lots of smart beta strategies are in the 0.50% range right now, which is a disadvantage versus the 0.07%-0.09% range for index funds, but many smart beta strategies have historically delivered much more than 0.41% outperformance.

Bottom line: any strategies edge (its potential outperformance) needs to be greater than the total cost differential versus a cap-weighted index. The best deciles of value and momentum stocks have outperformed the market by between 4%-6% annualized since the early 1960s[ii]. That is more than enough to overcome cost differentials. Will these excess return number persist over the next 10-20 years? Of course it is impossible to say.  But these factors (and others) sync nicely with the latest research in the behavioral economics field, have long and proven track records, and have continued to work despite widespread awareness of their existence and effectiveness.

Summing It Up

The funny thing about smart beta is that it’s gone by the name “quantitative investing” for two decades. Big names like Josef Lakonishok and Cliff Asness were writing papers about value and momentum in the early 90’s, and the first edition of What Works on Wall Street (which chronicles many “smart beta” factors) came out in 1996.

There are many successful quant firms that have posted consistent, market-beating results net of costs. Many of these firms are very well known, have great strategies, and manage taxes and turnover as best they can.

Cap weighted indexes do have big advantages.  A consistent strategy, low taxes, low trading costs, and low fees is a great combination. When looking for strategies other than cap-weighted indexes, look for ones that are rules based (consistent), use rules/factors that have worked well over long periods of history (like value and momentum), are different from the market, balance taxes and turnover with expected outperformance, and charge reasonable fees.

If you are investing in the stock market for long term success, then smart beta strategies with the right strategies can be a great alternative to cap-weighted benchmarks, but each should be evaluated on its own. So far, the leaders in the online financial advisory space (especially Wealthfront) have avoided smart beta. I will be very curious to see if it lasts. 


[i] Market Cap above $200MM, then inflation adjusted back in time

[ii] Complete stats for these any many other factors available in the latest edition of What Works on Wall Street

Millennials Are Screwing Up Their Investments

Young people are going about investing all wrong. The most basic (and important) decision you make as an investor is your allocation between major asset classes—primarily stocks, bonds, and cash.  Here is how millennials’ portfolios look in 2014, according to a recent research report from UBS.

This allocation screams caution, worry, and distrust of the stock market. Why are millennials investing this way? Mainly because they have had two very sour experiences with the stock market: the technology crash between 2000-2002 and the more dramatic financial crisis between 2007-2009.  Both times, the market collapsed 40% or more. The only other time that happened twice in one decade was in the 1930’s in the midst of the Great Depression. Millennials don’t trust Wall Street (all four major banks among most hated brands by millennials), and one of our most famous authors is saying the stock market is rigged.

With all this in mind, it makes sense that millennials are so cautious. But the choices they are making with their investments are backwards. Millennials think cash is safe, but its actually dangerous. They think that stocks are risky, but in fact stocks are the safest means to secure long-term financial prosperity.

The problem is that we tend to think of “risk” as a fixed concept—that is, stocks are riskier than cash and bonds…period. But risk can only be accurately assessed in combination with a time horizon.  If you are 25 and saving for retirement, you have at least a 40 year time horizon, which drastically changes what is risky and what is safe.  Millennials are making decisions as if they were 60 years old, on the verge of retirement—and it could cost them huge amounts of wealth.

The Potential of Every $1

I find it easiest to think about potential investments in terms of individual dollars. What returns are you likely to earn over certain time periods on every dollar you invest? What are the best and worst case scenarios? Let’s start with stocks—the most hated investment choice among millennials.

Obviously we want every dollar we invest to be worth as much as possible when we retire. The first figure below lists the average result for $1 invested in the stock market at various ages. It shows what each dollar will be worth by age 65 depending on when you start investing in the stock market (earlier if obviously much better). This assumes the market grows at the same real rate it has since 1926 (6.9% per year).  “Real” means after accounting for inflation, which reduces your returns. For the reasons I lay out in a separate piece on the history of money, inflation is a crucial consideration when evaluating investment options.

One important note: I am basing this analysis on data back to the 1920’s for stocks, bonds, and cash (bills) because it allows us to include events as diverse as the Great Depression, World War II, runaway inflation, booms, busts, panics, and so on. Everything short of a 100% breakdown is covered.

Note that the earlier you start, the more potent each dollar is. If you start at 22, then each dollar would be worth nearly $18 when you retire…but if you procrastinate, even until you are 40, each dollar would only be worth $5.30.

Millennials care more about risk than anything else, so let’s look at the worst case scenario alongside the average. These numbers represent the worst possible times to be invested (again starting at various different ages) between 1926 and 2014.

Sure enough, stocks are risky as hell in the short-term. Look at the worst-case scenario for the value of a dollar invested by people 50 years or older (who have between 5-15 years until retirement).  It would be terrible to invest in the stock market at age 50 and have each dollar worth just 70 cents 15 years later. That’s a scary 30% decline over 15 years.

But look at the worst case scenarios if you start younger. If you start at age 22, the worst result for a dollar invested was growth to $4.80.  This would have happened if you invested at age 22 in 1966 and retired in February 2009 at the exact market bottom of the second worse collapse in the stock market’s history. It also would have included the crash in 2000 and the miserable period for stocks between 1968 and 1982 when the market went nowhere. Even through three tumultuous markets, you’d still have $4.80 for every dollar you invested. 

You can see why risk cannot be assessed independent of time. Stocks can be very risky in the short term, but have been extremely safe over the long term, which is all that should matter to millennial investors.

Bonds and Cash

What about the “safe” options that millennials prefer? Here are the average and worst case scenarios for bonds and cash (t-bills).

For both bonds and bills, the worst case scenarios are scary across all time periods.  Even if you start investing when you are in your 20s, there is a chance that each dollar you put into bonds or bills will be worth less than 50 cents in real terms come retirement. For bonds and bills, inflation is the silent killer. Bonds and cash (bills) seem so safe because they preserve the number of dollars you have. But what good is preserving $100 until 2050 if a sandwich costs $80 at that point in the future? Purchased power is what matters, not the number of dollars you have. Judged this way, stocks are the runaway winner.

Think back to the current millennial investor’s allocation.  More than 50% is in cash, an asset that seems safe, but can be very dangerous over the long-term.  Meanwhile, millennials have just 28% in stocks, which even under the worst-case scenario have delivered strong long-term real returns.

What If The Sky Isn’t Falling?

I’ve focused on worst-case scenario because millennials are so sensitive to risk…but the best case scenarios are also worth considering.  Here is the best case scenario for each dollar invested at different ages for all three assets: stocks, bonds, and cash.

If you start investing in the stock market in your 20s, there is a chance each dollar ends up being worth much more than the $4.80-worst-case scenario or $18-average. There was one period where each dollar grew to $52 over 40 years. In sharp contrast, the best case over 40 years for bonds and bills was $6.70 and $1.90, respectively.

When Safe Isn’t Safe

Millennials are right to be cautious, but if their current investment allocations are any indication, too many millennials are thinking about short-term risk when they should be thinking about very long-term risk. When risk is reframed, stocks have always been the safest long term asset. The bottom line is that you should start investing now. Even if the initial amounts are very small, the long-term benefits are can be huge. But you have to start young and remember that what seems risky is in fact safe.


Monthly real returns for stocks, bonds and bills from Roger Ibbotson. Stocks = S&P 500, Bonds = Long Term  U.S. Government Bonds, Bills = T-Bills

UBS generational investing survey available here.